Tag Archives: statistics

SEALFAQS STATISTICS FOR 2019

The SealFAQs site did well in 2019 even though I sort of neglected it the past few months.  SealFAQs is alive and well and I have a number of updates and articles to add.

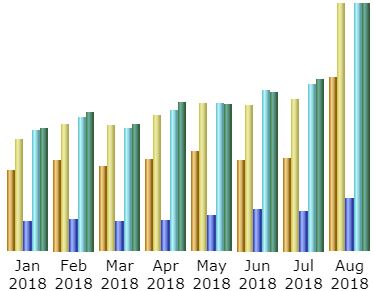
SealFAQs has been officially launched for two full years.  Here are the statistics for 2019 according to Awstats (Advanced Web Statistics):  SealFAQs had 33,020 unique visitors during 2019 and a total of 49,521 visits (1.5 visits/visitor).  Visitors averaged looking at 3 pages per visit.  Total bandwidth was 26 GB. 

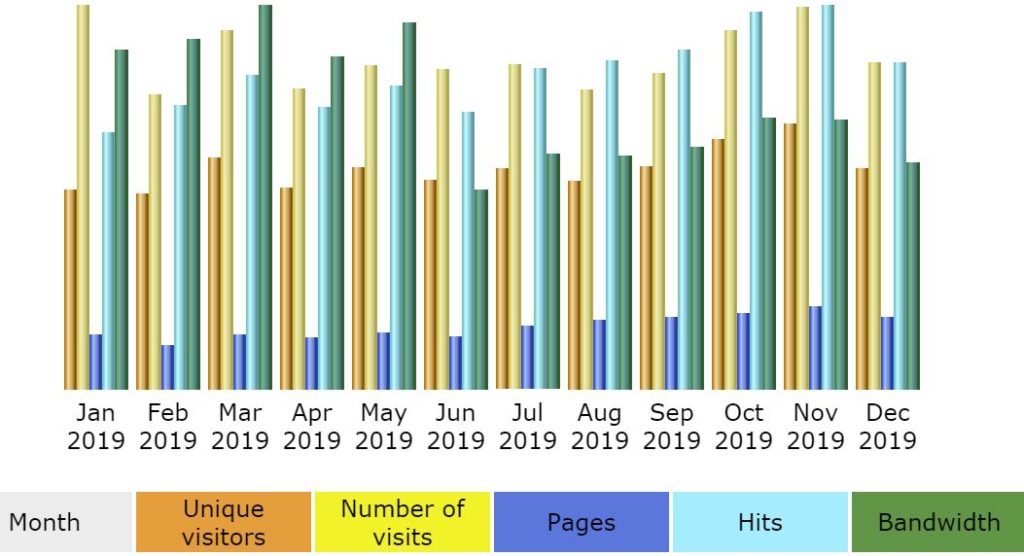
Most days, SealFAQs has about 120 to 150 visitors but it is not unusual to have around 200 visitors. The most visits in a day during 2019 was 305.   As usual, most people visit during the week and the middle part of the day.  There has always been a drop off in visits on the weekends and during a holiday season.

By far, the most visitors to SealFAQs are from the United States and distantly followed by Thailand, India, Russia, Ukraine, Sweden, Canada, Great Britain and Germany.

The average time of a visit to SealFAQs is about 4 to 5 minutes in duration but this average is probably because a few people log in for hours.  More than 80% of all visits are for less than 30 seconds. 

Access to SealFAQs via search engines is usually based on key phrases related to piping plans. 

I check SealFAQs for comments every day.  SealFAQs finally has some legitimate comments instead of the bits of spam or faked comments that show up daily. 

I was especially pleased to have added a history of John Crane – the Person during 2019. 

SealFAQs Statistics for December 2018

I almost forgot to publish statistics for December 2018!  The SealFAQs site is doing well but in 2019 I won’t be publishing statistics every month.  January 2019 views are at record highs so far.

SealFAQs statistics for December 2018.  December was a good month although not as good as November and October.  I blame the holiday season for the drop in viewers.

SealFAQs has been officially launched for a full year now.  In December, unique visitors dropped quite a bit from November and October.  Here are the statistics according to Awstats (Advanced Web Statistics).

SealFAQs had 2269 unique visitors during December and a total of 3970 visits (1.73 visits/visitor).  Visitors averaged looking at 2.2 pages per visit.  Bandwidth was 2.0 GB.  So the visits per visitor increased but pages per visit dropped a little.

Visits per day during December averaged 128; the most visits in a day was 196.   As usual, most people visit during the week and the middle part of the day.  There has always been a drop off in visits on the weekends and this drop off also occurred during the holiday season.

By far, the most visitors are from the United States and distantly followed by Thailand, India and Russia.

The average time of a visit decreased to 272 seconds in duration but 84% of all visits are still for less than 30 seconds.  It does appear that some people are logging in and staying on the site an hour or more – forgetting to log out or reading/studying?

Access to SealFAQs via search engines was based on 8 different keyphrases having 17 different words.  As in the past, piping plans were the most common search words.

I check SealFAQs for comments every day.  Almost no one has submitted a real comment but several bits of spam or faked comments show up daily.  The lack of comments and discussion continues to be troublesome to me.

SealFAQs Statistics for November 2018

SealFAQs statistics for November 2018.  November was the best month, so far, of 2018 although realistically, only fractionally better than October.

SealFAQs has been officially launched for eleven months now.  In November, unique visitors increased quite a bit from previous months.  Here are the statistics according to Awstats (Advanced Web Statistics).

SealFAQs had 2675 unique visitors during November and a total of 3980 visits (1.48 visits/visitor).  Visitors averaged looking at 2.4 pages per visit.  Bandwidth was 2.4GB.  So the visits per visitor and pages per visit has remained about the same for several months. This means that many visitors do not make a return visit and also look at only a few pages.

Visits per day during November averaged 132; the most visits in a day was 199 – twice!.   As usual, most people visit during the week and the middle part of the day.  There has always been a drop off in visits on the weekends.

By far, the most visitors are from the United States and distantly followed by India and China.

The average time of a visit decreased to 283 seconds in duration but 82% of all visits are still for less than 30 seconds.  It does appear that some people are logging in and staying on the site an hour or more – forgetting to log out or reading/studying?

Access to SealFAQs via search engines was based on 9 different keyphrases having 23 different words.

I check SealFAQs for comments every day.  Almost no one has submitted a real comment but several bits of spam or faked comments show up daily.  The lack of comments and discussion continues to be troublesome to me.

SealFAQs statistics for October 2018

October was the best month, so far, of 2018.

SealFAQs has been officially launched for ten months now.  In October, unique visitors increased quite a bit from previous months.  Here are the statistics according to Awstats (Advanced Web Statistics).

SealFAQs had 2634 unique visitors during October and a total of 3769 visits (1.43 visits/visitor).  Visitors averaged looking at 2.3 pages per visit.  Bandwidth was up to 2.4GB.  So the visits per visitor and pages per visit has remained about the same for several months. This means that many visitors do not make a return visit and also look at only a few pages.

Visits per day during October averaged 121; the most visits in a day was 166.   As usual, most people visit during the week and the middle part of the day.  There has always been a drop off in visits on the weekends.

By far, the most visitors are from the United States and distantly followed by India and China.

The average time of a visit decreased to 304 seconds in duration but 80% of all visits are still for less than 30 seconds.  It does appear that some people are logging in and staying on the site an hour or more – forgetting to log out or reading/studying?

Access to SealFAQs via search engines was based on 16 different keyphrases including, as usual, several searches for information on piping plans.

I check SealFAQs for comments every day.  Almost no one has submitted a real comment but several bits of spam or faked comments show up daily.  The lack of comments and discussion continues to be troublesome to me.

SealFAQs statistics for September 2018.

Whatever happened in August or late July has had a continuing effect:  SealFAQs is being visited much more often than in the past.

SealFAQs has been officially launched for nine months now.  In September, unique visitors actually decreased from August by about one day’s worth of visitors.  Here are the statistics according to Awstats (Advanced Web Statistics).

SealFAQs had 2079 unique visitors during September and a total of 3013 visits (1.45 visits/visitor).  Visitors averaged looking at 2.3 pages per visit.  Bandwidth was up to 1.8GB.  This means that many visitors do not make a return visit and also look at only a few pages.

Visits per day during September again averaged 100; the most visits in a day was 144.   As usual, most people visit during the week and the middle part of the day.  There has always been a drop off in visits on the weekends.

By far, the most visitors are from the United States and distantly followed by India and Canada.

The average time of a visit increased to 350 seconds in duration but 80% of all visits are still for less than 30 seconds.  It does appear that some people are logging in and staying on the site an hour or more – forgetting to log out or reading/studying?

Access to SealFAQs via search engines was based on 19 different keyphrases including several searches for information on piping plans.

I check SealFAQs for comments every day.  Almost no one has submitted a real comment but several bits of spam or faked comments continue to show up daily.

October is shaping up to be another good month.

SealFAQs statistics for August 2018

Something happened in August or late July and, whatever it was, SealFAQs has been visited much more often.  Here’s a chart showing SealFAQs statistics since being launched in January.

Monthly History to Aug 2018

SealFAQs has been officially launched for eight months now.  In August, unique visitors increased significantly – nearly doubling —  from July.  Here are the statistics according to Awstats (Advanced Web Statistics).

SealFAQs had 2196 unique visitors during August and a total of 3121 visits (1.42 visits/visitor).  Visitors averaged looking at 2.2 pages per visit.  Bandwidth was up to 1.7GB.  So although more people visited SealFAQs, many did not make a return visit and they also only looked at a few pages.

Visits per day during August increased to an average of 100;  the most visits in a day was 177 – both are new highs.   As usual, most people visit during the week and the middle part of the day.

By far, the most visitors are from the United States and distantly followed by India, Russia, China, Canada and others.

The average time of a visit decreased to 317 seconds in duration but 81% of all visits are still for less than 30 seconds.  It appears that some people are logging in and staying on the site an hour or more.

Access to SealFAQs via search engines was based on 15 different keyphrases including several searches for information on piping plans.

I check SealFAQs for comments every day.  Almost no one has submitted a real comment but several bits of spam or faked comments show up daily.

So August may mark a change in SealFAQs viewership.  It appears that someone or some organization has discovered SealFAQs.

SealFAQs statistics for July 2018

SealFAQs has been officially launched for seven months now.  In July, unique visitors increased slightly from June.  Here are the statistics according to Awstats (Advanced Web Statistics).

SealFAQs had 1170 unique visitors during July and a total of 1912 visits (1.63 visits/visitor).  Visitors averaged looking at 4.7 pages per visit – the same as for June.  Bandwidth was up to 1.2GB.

Visits per day during July was the same as during June with an average of 61;  the most visits in a day was 90.   As usual, most people visit during the week and the middle part of the day.

By far, the most visitors are from the United States and distantly followed by Nigeria, India, Russia, South Korea, Poland, China, Canada and others.

The average time of a visit has increased to 460 seconds in duration but 75% of all visits are still for less than 30 seconds.  It appears that some people are logging in and staying on the site an hour or more.

Access to SealFAQs via search keyphrases was 6 different keyphrases including “fundamentals of bellows design” – that’s a good project for the future.  Also, it seems that someone was searching for information on piping plans.

I check SealFAQs for comments every day.  Almost no one has submitted a real comment but several bits of spam or faked comments show up daily.

So July was about the same as June for SealFAQs.  Interestingly, August already shows a large increase in viewers so someone or some organization has discovered SealFAQs.

SealFAQs statistics for June 2018

SealFAQs has now been officially launched for six months.  In June, unique visitors decreased slightly from May by about the difference in the length of the month and the fact that June had five weekends whereas May had only four.   Here are the statistics according to Awstats (Advanced Web Statistics).

SealFAQs had 1149 unique visitors during June and a total of 1847 visits (1.61 visits/visitor).  Visitors averaged looking at 4.7 pages per visit – a significant increase.  Bandwidth was up to 1.1GB.

Visits per day during June increased from the May average of 60 to 61 with the most visits in a day being 87 – twice!  As usual, most people visit during the week and the middle part of the day.

By far, the most visitors are from the United States and distantly followed by India, Russia, South Korea, Poland, China, Canada and others.

The average time of a visit has increased to 442 seconds in duration but 77% of all visits are still for less than 30 seconds.  It appears that some people are logging in and staying on the site an hour or more.

Access to SealFAQs via search keyphrases was down a little with 5 different keyphrases including “api 682”.  The most common keyword is “seal” of course.

June was a decent month for SealFAQs with some gains in viewing.

SealFAQs statistics for May 2018

SealFAQs has been officially launched for five months now.  In May, unique visitors picked up from April; in fact, May was the best month so far.  Here are the statistics according to Awstats (Advanced Web Statistics).

SealFAQs had 1263 unique visitors during May and a total of 1872 visits (1.48 visits/visitor).  Visitors averaged looking at 3.56 pages per visit.

Visits per day during May increased from the April average of 57 to 60 with the most visits in a day being 98 – a new record!  As usual, most people visit during the week and the middle part of the day.

By far, the most visitors are from the United States and distantly followed by India, Russia, China, Canada, Great Britain and others.

Visits average about 243 seconds in duration but most visits are still for less than 30 seconds.

Access to SealFAQs via search keyphrases was down a little with 5 different keyphrases including “buffer and barrier fluid” and “mechanical seal company”.  The most common keyword is “seal” of course.

May was a good month for SealFAQs.

SealFAQs Statistics for March 2018

SealFAQs has been officially launched for three months now.  Strangely, visits fell off a bit during March.  Here are the statistics according to Awstats (Advanced Web Statistics).

SealFAQs had 1061 unique visitors during March – a slight decrease from February and a total of 1591 visits (1.49 visits/visitor).  Visitors averaged looking at 2.34 pages per visit.

Visits per day during March decreased from the February average of 57 to 51 with the most visits in a day being 77.  As usual, most people visit during the week and the middle part of the day.  In March, there seemed to be more visits on Monday than has been typical.

By far, the most visitors are from the United States and distantly followed by India, Russia, China, Canada, Great Britain and others.

Visits average about 143 seconds in duration and most visits are for less than 30 seconds.

I was expecting March to be a good month for SealFAQs  — still don’t understand why visits fell off a bit.  On the positive side, April is off to a good start.