
Something happened in August or late July and, whatever it was, SealFAQs has been visited much more often. Here’s a chart showing SealFAQs statistics since being launched in January.
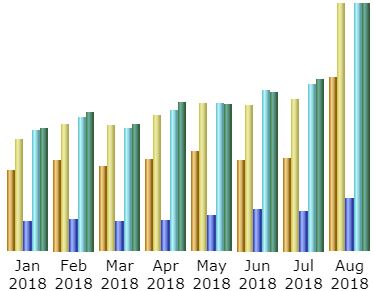
SealFAQs has been officially launched for eight months now. In August, unique visitors increased significantly – nearly doubling — from July. Here are the statistics according to Awstats (Advanced Web Statistics).
SealFAQs had 2196 unique visitors during August and a total of 3121 visits (1.42 visits/visitor). Visitors averaged looking at 2.2 pages per visit. Bandwidth was up to 1.7GB. So although more people visited SealFAQs, many did not make a return visit and they also only looked at a few pages.
Visits per day during August increased to an average of 100; the most visits in a day was 177 – both are new highs. As usual, most people visit during the week and the middle part of the day.
By far, the most visitors are from the United States and distantly followed by India, Russia, China, Canada and others.
The average time of a visit decreased to 317 seconds in duration but 81% of all visits are still for less than 30 seconds. It appears that some people are logging in and staying on the site an hour or more.
Access to SealFAQs via search engines was based on 15 different keyphrases including several searches for information on piping plans.
I check SealFAQs for comments every day. Almost no one has submitted a real comment but several bits of spam or faked comments show up daily.
So August may mark a change in SealFAQs viewership. It appears that someone or some organization has discovered SealFAQs.