
Pumping rings are used to circulate process fluid, buffer fluids or barrier fluids. In the application of pumping rings, the questions to be answered frequently are:
- What is the recommended flow rate?
- What will be the actual flow rate?
- How to improve (increase) the flow rate?
The discussion and examples below illustrate the concept that the circulation rate is produced by the combined requirements and performances of the pumping ring and piping system.
Flow Requirements
Flow guidelines for pumping rings are generally based on the same guidelines as for recommended flush rates.
Typical Piping System
The actual circulation rate depends on the performance of a particular pumping ring in a particular piping system for a particular fluid. It is convenient to define a “standard” piping system. API 682 Annex F defines a standard piping system for Plans 52 and 53A to have a 8.2 feet of pipe leading to the reservoir and 8.2 feet of pipe returning from the reservoir to the seal.
System Curves
A system curve shows the relationship of flow and pressure for a given piping system. As an example, in order to produce more flow, additional pressure (really pressure difference) is required.
In a system curve, the vertical axis is the head (or pressure) that is required to produce the flow rate on the horizontal axis. From Figure 1, in order to pump, say, 4 gpm of water through a Plan 53A system made of 3/4″ tubing, a pump must be able to develop ~8 feet of head (while pumping 4 gpm). If 1/2″ tubing were used, the pump must develop ~42 feet of head.
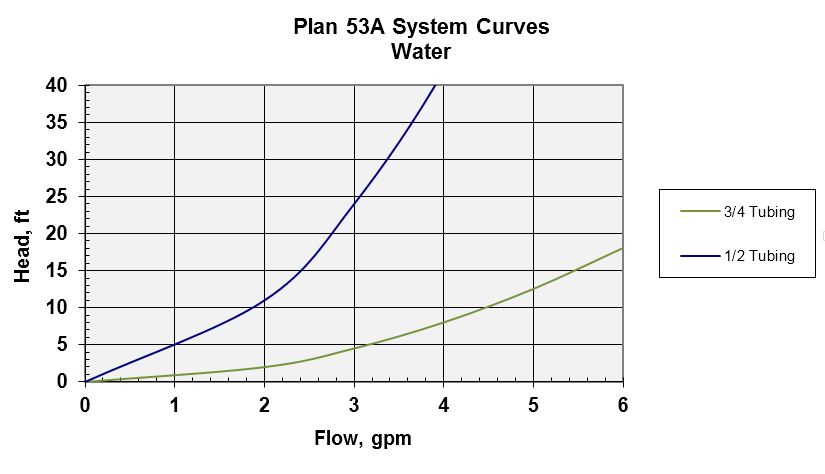
API 682 Annex F gives a slightly different, although somewhat similar, system curve for water in Plan 53A.
The frictional flow losses that make up the system curve can be determined with manual calculations or many computer programs. Frictional losses are approximately proportional to flow rate squared so a curve may be extrapolated from a known data point.
In addition to pipe size and length, other variables that affect the system curve include: number of fittings, type of fitting, static head and type of fluid. Although the specific gravity of the fluid has some affect on the system curve, viscosity is the most significant fluid property. In particular, lubricating oils with viscosities greater than around 5 centipoise require more head to produce a given flow. For Piping Plans 52, 53A, 53B, 53C, the user can select an appropriate buffer or barrier fluid and should keep the system curve in mind while doing so.
Pumping Ring Performance Curves
The various built-in circulating devices that produce flow for mechanical seal systems are usually described as pumping rings. Common designs include:
- radial flow impellers using drilled vanes
- radial flow using slots
- axial flow using spiral grooves
See the page for Design of Pumping Rings.
Combined Pumping Ring and System Curves
The actual circulation rate depends on both the pumping ring performance curve and the system curve. In fact, the circulation rate is determined by the intersection of the two curves.
Figure 2 shows the expected performance of a partially slotted pumping ring when pumping water through the Plan 53A system shown in Figure 1.
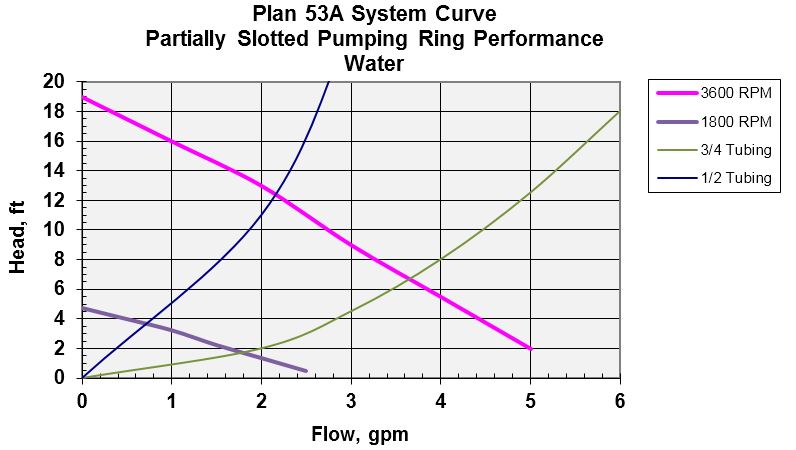
From Figure 2, for operation at 3600 rpm the circulation rate will be about 2.2 gpm through 1/2″ tubing or about 3.6 gpm through 3/4″ tubing. However, at 1800 rpm, the circulation rates are only 0.7 and 1.8 gpm.
In this section, typical system curves are combined with various pumping ring performance curves to illustrate the concepts that effect the circulation rate.
Plan 23
Whereas Plan 53A has the barrier fluid flowing through a large reservoir and then over its cooling coils, Plan 23 has the process fluid flowing through the coils of a heat exchanger. Typically, the cooling coil is made from 20 to 30 feet of tubing. Therefore, it is easy to imagine that the system curve for Plan 23 shows a requirement for more head than does the system curve of Plan 53A.
Figure 3 shows a comparison of the system curves for Plan 23 and Plan 53A. Figure 3 might seem somewhat misleading because Plan 23 is shown for 1/2″ pipe whereas Plan 53A is shown for 3/4″ tubing. However, the inside diameters of the pipe and tubing are about the same. The ID of 1/2″ SCH 40 pipe is 0.622 inch; the ID of the 3/4″ x 0.095 wall tubing is 0.560″. The main difference in the curves shown in Figure 3 is the flow through the cooling coils of Plan 23 in the commercially available heat exchanger.
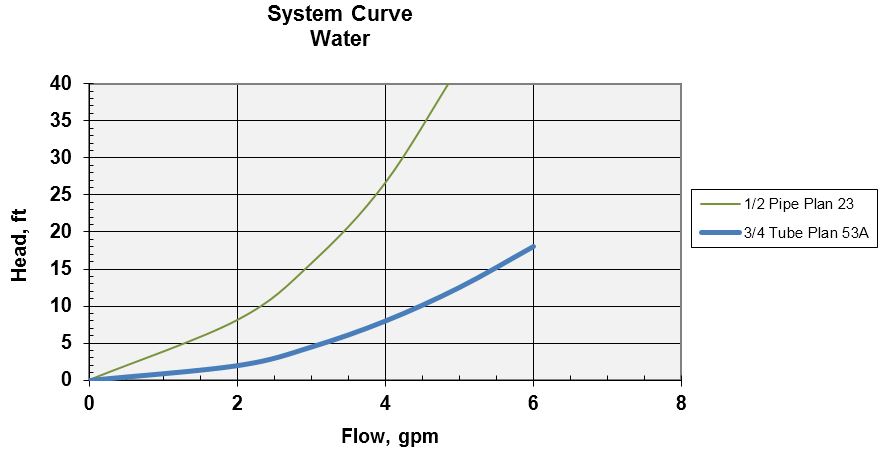
Although these system curves and this discussion take no credit for the thermal syphoning effect, thermal syphoning is an important aspect of Plan 23. The system must be designed to promote thermal syphoning in order to keep the seal area cool when the pump shaft is not rotating. In general, designing for thermal syphoning includes using large piping and large holes, having the exchanger elevated around two feet above the centerline of the shaft and using a bottom entry/top exit gland design. In addition, the cooling water supply to the heat exchanger must be maintained even when the pump is not in use.
Plan 53B and 53C
Like Plan 23, the system curve for Plans 53B and 53C would show the effects of barrier fluid flowing through the coils of the heat exchanger. In fact, system curves for Plans 53B and 53C are very similar to the system curves for Plan 23 in Figure 3.
Figure 4 shows system curves for three popular buffer/barrier fluids in 1/2″ and 3/4″ tubing.
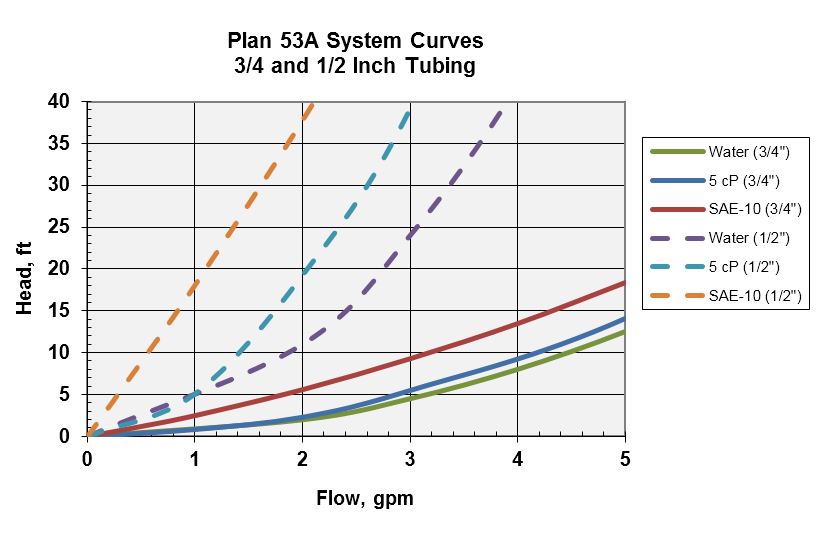
Notice that the head loss for 1/2″ tubing is particularly severe for oils.
Figure 5 overlays the partially slotted pump ring curve used in Figure 2 over the system curves of Figure 4.
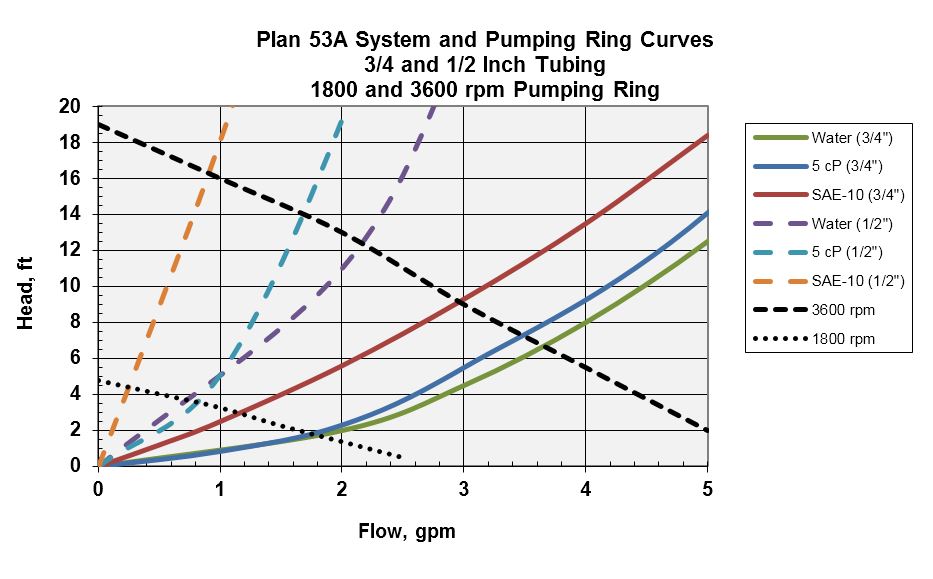
Remember that the actual operating point (flow and pressure) is at the intersection of the system and pumping ring curves. Thus the flow rate of SAE-10 oil in 1/2″ tubing would be ~0.8 gpm for a 3600 rpm pumping ring and ~0.4 gpm for 1800 rpm.
Plan 52
At first glance, it can be difficult to distinguish between Plan 52 and 53A; in fact, the API schematics are very similar with respect to the piping flow path. Therefore, the system curve for Plan 53A (Figure 2) will also be used herein for Plan 52; however, there is an additional consideration for Plan 52.
Whereas Plan 53A is a closed system, Plan 52 is vented to atmosphere (but could be vented to a flare system, etc.). Therefore, in Plan 52, flow from the reservoir into the containment chamber should be considered as limited to gravity flow — that is, a function only of the static head above the centerline of the shaft. Of course, the effects of the pumping ring could “pull” more fluid into the containment chamber but, in doing so, a vacuum would be created in the containment chamber. In the event of a vacuum in the containment chamber, a number of bad things might happen:
- air is sucked in
- between the faces (meaning “dry” running)
- other leak points
- absorbed air is liberated from the buffer fluid
- possible NPSH problems at pumping ring.
Therefore, some consideration should be given towards preventing a vacuum in the containment chamber.
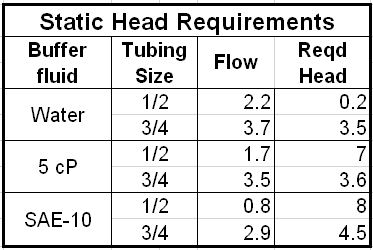
Considering that Plan 52 is somewhat symmetrical with respect to the inlet and outlet piping, approximately half the total head loss occurs in the reservoir outlet (containment chamber inlet) piping. This approximation allows us to assign 1/2 the total loss to the reservoir outlet (seal chamber inlet) piping. For example, imagine a system using 1/2″ tubing and 5 cP buffer fluid. From Figure 5, the flow rate would be 1.7 gpm for a 3600 rpm pumping ring. The total head loss in the system at 1.7 gpm flow would be 16 feet. Of this head loss, ~8 feet of head would be lost in the reservoir outlet (seal chamber inlet) piping. Because the reservoir is operating at atmospheric pressure, if the static head (liquid level plus reservoir elevation) to the pumping ring is less than 8 feet then the containment chamber would be in vacuum. Not good!
Typically, the available static head to the pumping ring is about 3 to 5 feet of liquid. This is not to say that a reservoir could not be elevated but that, typically, it is not.
Table 1 shows the required static head (reservoir elevation for the Plan 52 system shown in Figure 5.
Is static head a problem for Plan 52? Yes, it certainly is. Is the above analysis absolute? No, certainly not. This “analysis” merely illustrates the potential for problems. One solution is to raise the reservoirs but another is to avoid viscous buffer fluids and to use large pipe/tubing.
Effect of Viscosity
The system curves for fluids with relatively low viscosity, say, less than 2 cP, are essentially the same as the system curves for water. System curves for higher viscosity should be considered as special cases for analysis/review. Realistically, higher viscosity oils should not be used as buffer/barrier fluids.